
Oct 20, 2026
LA/Long Beach Holds Three Ships Awaiting Berth, US Queue Climbs to 7
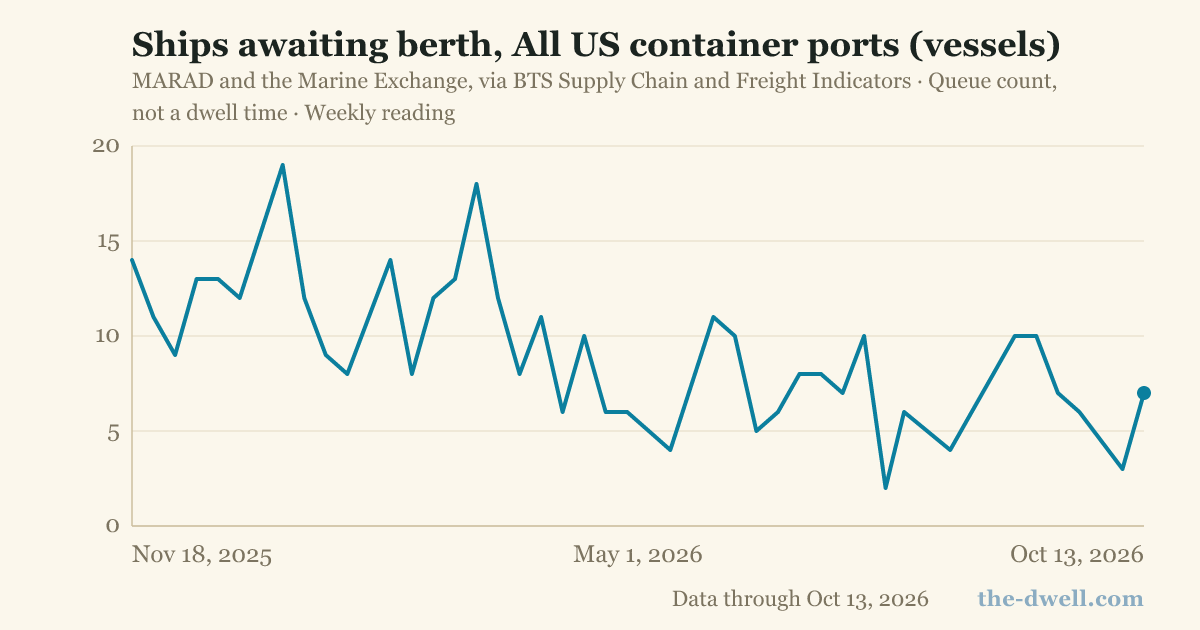
LA/Long Beach ships-awaiting-berth count stands at 3, above the trailing-12-month normal of 1, holding the complex at Some pressure. The US-wide total reached 7 ships, up 133% week over week from 3.
Numbers as of Oct 20, 2026 pull
Cite
Get the weekly port brief
Get The Dwell in your inbox every Tuesday. No spam, we won't ever share your email, and you can always unsubscribe.
The ships-awaiting-berth count at LA/Long Beach stands at 3 ships this week, above the complex's trailing-12-month normal of 1 ship (per MARAD and the Marine Exchange), and is the primary factor holding LA/Long Beach's import-friction read at Some pressure. The US-wide ships-awaiting-berth total at all container ports climbed to 7 ships, up 133.3% week over week from 3, per MARAD.
- Savannah ships awaiting berth rose to 2 ships, up 100% week over week from 1 ship, per MARAD and the Marine Exchange. The count is 89% below the four-year median and sits near the trailing-12-month normal of 2 ships. The Savannah friction read remains Flowing.
- East Coast ships at anchor: 3 ships, unchanged week over week, 87% below the four-year median, per MARAD.
- Gulf Coast ships at anchor: 1 ship, 88% below the four-year median, per MARAD.
- Truck PTI at LA/Long Beach measured 2.26 and at NY/NJ measured 2.23 (both BTS), below their trailing-12-month normals of 4.07 and 3.82. Drayage-side friction is eased at both complexes. NY/NJ's import-friction read is Flowing.
- Long Beach rail, nine-plus-day containers: the standing total fell to 1,664, down 43.9% week over week from 2,968, per Port of Long Beach. The BNSF portion fell to 1,118, down 58.1% week over week from 2,667, the steepest single-week drop among this issue's tracked metrics. Containers newly aging past nine days rose to 546 from 301, up 81.4% week over week.
Per the Northwest Seaport Alliance's Oct 19 release, NWSA September 2026 total container volume reached 265,692 TEUs, down 8.1% year over year. Full imports fell 4.4% year over year and full exports fell 9.6% year over year. The alliance noted volumes remain below 2025 levels, which reflected tariff pull-forward demand.
Monthly TEU figures in the friction reads above are the latest available monthly data and lag the current week by several weeks.