
Oct 13, 2026
Long Beach Outbound Rail Up 22%, Nine-Plus-Day Units Fall to 301
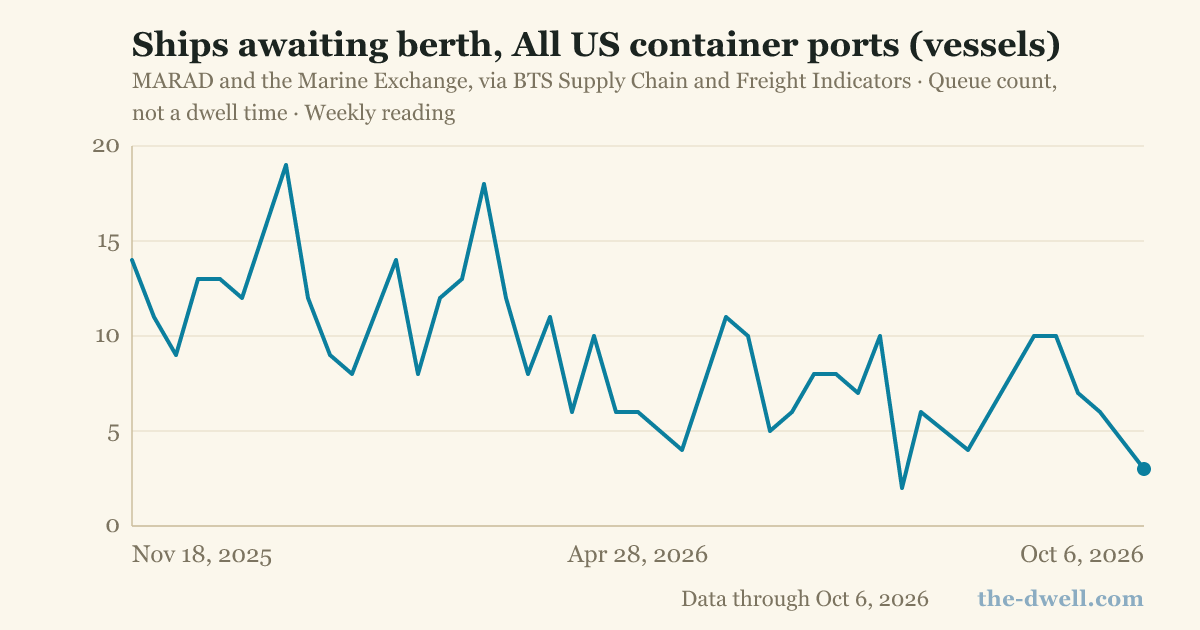
LA/Long Beach stays Flowing. Long Beach outbound rail rose to 3,047 units, up 22% week over week. Nine-plus-day pending units fell 60% to 301. US ships awaiting berth: 3, well below the five-year median.
Numbers as of Oct 13, 2026 pull
Cite
Get the weekly port brief
Get The Dwell in your inbox every Tuesday. No spam, we won't ever share your email, and you can always unsubscribe.
Long Beach total outbound rail units rose to 3,047 this week, up 21.7% week over week from 2,503, per Port of Long Beach data. Outbound-pending containers with nine or more days of rail-yard dwell fell to 301, a 59.9% drop from 750 the prior week, the largest single-series weekly move in the digest. LA/Long Beach import-friction read is Flowing: ships awaiting berth at zero and the truck planning-time index running below its trailing-12-month normal.
- Ships awaiting berth, LA/Long Beach (MARAD/Marine Exchange): 0 ships this week, 100% below the five-year median and below the trailing-12-month normal of 1 ship.
- Ships awaiting berth, all US (MARAD): 3 ships, 88.5% below the five-year median. East Coast ships at anchor: 3 ships, 84.2% below the five-year median.
- Ships awaiting berth, Savannah (MARAD/Marine Exchange): 1 ship, 92.3% below the five-year median and below the trailing-12-month normal of 2 ships. Import-friction read: Flowing.
- Long Beach rail yard, containers with nine-plus-day rail-yard dwell (Port of Long Beach): 2,968 units, down 10.9% week over week from 3,332. BNSF-specific nine-plus-day count: 2,667 units, up 3.3% week over week from 2,582.
- Truck planning-time index (BTS): LA/Long Beach at 2.26, below the trailing-12-month normal of 4.07. NY/NJ at 2.23, below the trailing-12-month normal of 3.82. Both complexes at Flowing.
LA/Long Beach loaded imports reached 967,013 TEU in the latest available monthly data, above the trailing-12-month normal of 848,128 TEU, per port authority statistics. Per the Port of Los Angeles September 9 release, August volume was 6% above the port's five-year average for the month, capping the busiest three consecutive months in port history. NY/NJ loaded imports: 392,074 TEU, near the trailing-12-month normal of 382,286 TEU. Savannah: 251,888 TEU, near the trailing-12-month normal of 239,584 TEU.
Monthly loaded-import TEU figures reflect August 2026, the latest month available. September data has not been published.