
Sep 1, 2026
Savannah Friction Read at Some Pressure, Ship Queue Doubles to 4
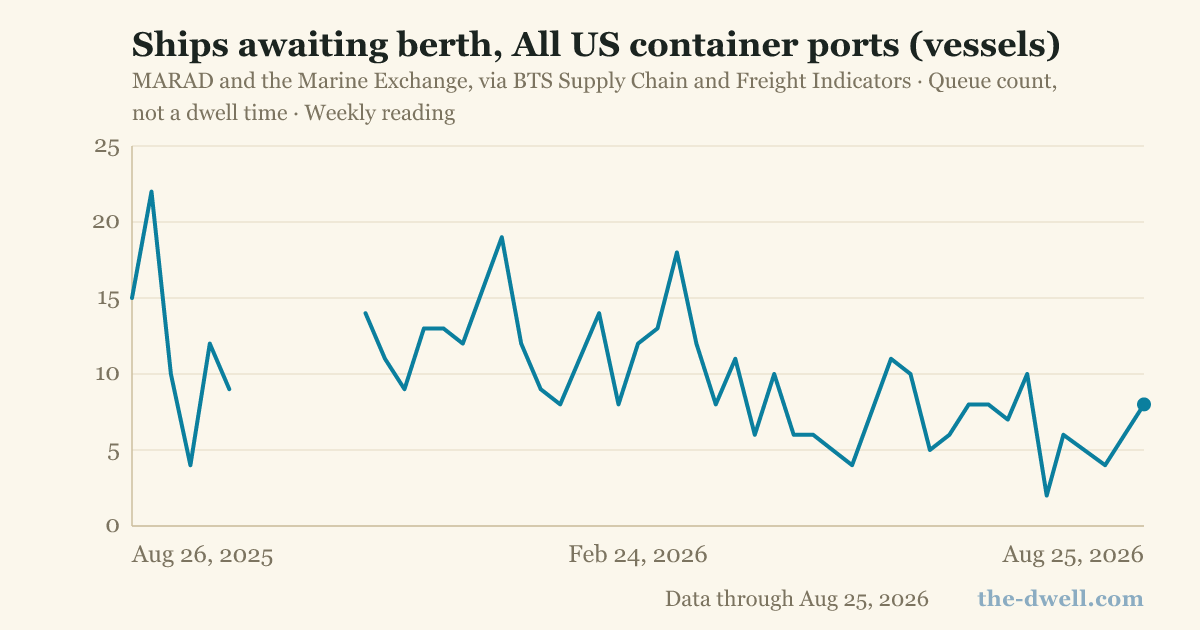
Savannah's friction read sits at Some pressure as ships awaiting berth doubled to 4, above the trailing-12-month normal of 2. LA/Long Beach cleared to zero. The US total is 8 ships, still 50% below the five-year median.
Numbers as of Sep 1, 2026 pull
Cite
Get the weekly port brief
Get The Dwell in your inbox every Tuesday. No spam, we won't ever share your email, and you can always unsubscribe.
Savannah's import-friction read is at Some pressure, with ships awaiting berth at 4 ships (per MARAD), double the trailing-12-month normal of 2. The US total of ships awaiting berth at all container ports rose to 8, up 33% week over week, but remains 50% below the five-year median.
- LA/Long Beach ships awaiting berth fell to 0 ships, down 100% week over week, 100% below the five-year median (per MARAD). The West Coast ships at anchor also cleared to 0, down 100% week over week.
- Savannah ships awaiting berth: 4 ships, up 100% week over week from 2 ships, 20% below the five-year median (per MARAD). The queue is now above the trailing-12-month normal of 2, which drives the Some pressure friction read.
- East Coast ships at anchor: 7 ships, up 75% week over week, 50% below the five-year median (per MARAD).
- All US container ports ships awaiting berth: 8 ships, up 33% week over week, 50% below the five-year median (per MARAD).
- LA/Long Beach friction read: Flowing. Ships awaiting berth at 0 (trailing-12-month normal: 1 ship). Truck planning-time index 2.19, below its trailing-12-month normal of 4.07 (per BTS).
- NY/NJ friction read: Flowing. Truck planning-time index 2.37, below its trailing-12-month normal of 3.95 (per BTS).
Latest available monthly loaded-import volumes: LA/Long Beach 917,583 TEU (trailing-12-month normal 831,412 TEU), NY/NJ 388,842 TEU (normal 372,973 TEU) and Savannah 240,445 TEU (normal 231,586 TEU), all near normal. Per the Northwest Seaport Alliance's Aug 20, 2026 release, NWSA full imports fell 11.6% in July 2026 versus July 2025, with YTD full imports down 13.7%.
Monthly TEU volumes are the latest available from each port authority and lag the current week; the NWSA July 2026 figures were published Aug 20, 2026.